Red sandstone formations under a wide blue sky streaked with clouds, framed by green shrubs in the foreground
Advocacy · Native American health

Indian Health & Native American Health Advocacy

Fort Defiance, Arizona

As a surgeon and palliative care physician, I care for people facing operations and people facing serious illness, and I try to truly listen to both. For American Indian and Alaska Native patients, too much of that care comes later, farther from home, and with fewer resources. The gaps are not abstract to me. They mean long drives to a surgeon, cancers found too late, and families saying goodbye years too soon.

I believe the federal promise of health care to Tribal Nations is a promise worth keeping, and I want to help keep it. I’m gathering here the research that shaped my thinking and the organizations doing the work. I hope it’s useful to patients, students, colleagues, and anyone who wants to learn and help.

01Chapter 1 of 6

Traditional healing and trust

A log hogan with a snow-covered roof, with firewood stacked beside it and snow on the ground

Traditional healing at Tséhootsooí

Near the hospital at Tséhootsooí stands a hogan, the traditional Diné structure where healing ceremonies are conducted. Through its Traditional & Cultural Services, the Fort Defiance Indian Hospital Board integrates Navajo traditional healing with modern care, with access to traditional healers, ceremonies and cultural education. Patients can request these services through their medical provider.

Further reading: The Healing Power of Ceremony, University of Arizona Health Sciences

Fort Defiance, Arizona, in winter

02Chapter 2 of 6

Representation: Native surgeons

A national society for Native surgeons, launched in September 2024 at the American College of Surgeons Clinical Congress in San Francisco. Its story is told in the featured article below by Lyndsay A. Kandi, J. Caleb Shahbandeh, and colleagues (see also about NASS).

NASS welcomes non-Native allies: it invites allies and stakeholders, and Native physicians in specialties outside surgery, to get involved. Join NASS

“Given the small number of practicing Native surgeons nationally, meaningful progress will depend on partnerships among Native surgeons, non-Native faculty mentors, residency programs, academic institutions, and professional organizations.”
Kandi et al., Fulfilling the dreams of our ancestors: Building the Native American Surgical Society, 2026, p. 4
Photo from the first Natives in Surgery workgroup meeting, held in 2023 at the 51st Annual AAIP Meeting and Conference in San Diego, CA. Photo: Native American Surgical Society
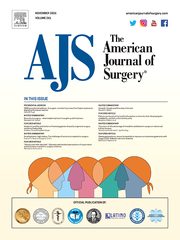
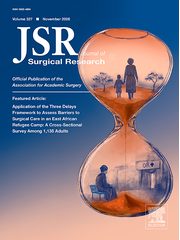
Cover of The American Journal of Surgery

Featured article

Fulfilling the dreams of our ancestors: Building the Native American Surgical Society

Kandi LA, Shahbandeh JC, Bongiovanni T, Jensen V, Denipah N, Alvord LA. The American Journal of Surgery, vol. 260, article 117147, October 2026 (published online July 21, 2026). PubMed

The six founding trustees of NASS describe how the society grew out of talking circles and consensus workgroups at the 2023 and 2024 Association of American Indian Physicians meetings, with participants from 36 tribal affiliations. They call it the first Indigenous-led national effort to support AI/AN surgeons.

The authors include Dr. Lori Arviso Alvord, the first member of the Navajo tribe to be board-certified in surgery, and Dr. Vanessa Jensen, Chief of Surgical Services at Tséhootsooí Medical Center (Fort Defiance Indian Hospital) in Fort Defiance, Arizona, a hospital run by the tribe itself, under the Indian Self-Determination Act, on the Navajo Nation.

Still, Native people remain far from parity in medicine. American Indian and Alaska Native people make up:

  • 3%of the U.S. population
  • <0.5%of practicing physicians
  • 0.28%of surgeons
  • 0.09%of surgical residents
Kandi et al., Fulfilling the dreams of our ancestors: Building the Native American Surgical Society, The American Journal of Surgery, 2026, p. 1

Fixing the pipeline

For American Indian and Alaska Native students.

In college

Applying to medical school

Through medical school

More for premeds and medical students

Native surgeons on #ILookLikeASurgeon.

03Chapter 3 of 6

Where IHS serves

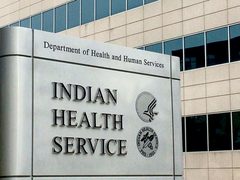
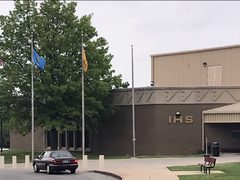
Depending on which IHS Area a Native person lives in, life expectancy can be as much as 15 years below the U.S. average, and tribes are leading the fixes.

Map of the 12 Indian Health Service AreasSelect an Area to see its headquarters, states, a key health gap and what is working there. The same details are listed after the map for screen readers.
The 12 IHS Areas. Alaska is shown as an inset, not to scale. Map data: Indian Health Service (public domain).

The 12 IHS Areas

  • Alaska AreaAnchorage, AK
    All of Alaska. Nearly the entire budget goes to Tribal health organizations under the Alaska Tribal Health Compact, which serves all 228 federally recognized tribes in the state.

    States: AK

    Life expectancy · 2018–202069.5 years, vs. 78.8 for the U.S. (all races, 2019). IHS Life Expectancy report, 2018–2020

    What’s workingAbout 99% of the Area budget goes to Tribes and Tribal organizations. The Area also has 148 tribal community health aide clinics. Alaska Area (IHS)

  • Albuquerque AreaAlbuquerque, NM
    27 tribal groups, including 20 Pueblos, in New Mexico, Colorado, Texas and Utah.

    States: NM, CO, TX, UT

    Life expectancy · 2018–202074.6 years, vs. 78.8 for the U.S. (all races, 2019). IHS Life Expectancy report, 2018–2020

    What’s workingThe Area takes part in national IHS initiatives including the Special Diabetes Program for Indians and the Meth and Suicide Prevention Initiative. Albuquerque Area (IHS)

  • Bemidji AreaBemidji, MN
    34 Tribes and 4 urban Indian programs in Illinois, Indiana, Michigan, Minnesota and Wisconsin.

    States: IL, IN, MI, MN, WI

    Life expectancy · 2018–202069.0 years, vs. 78.8 for the U.S. (all races, 2019). IHS Life Expectancy report, 2018–2020

    What’s workingTribal health services run through 11 Title V self-governance compacts and 23 Title I contracts. Bemidji Area (IHS)

  • Billings AreaBillings, MT
    More than 70,000 people across Montana and Wyoming.

    States: MT, WY

    Life expectancy · 2018–202063.1 years, vs. 78.8 for the U.S. (all races, 2019). IHS Life Expectancy report, 2018–2020

    What’s workingCare runs through five tribally operated health departments and five Urban Indian health programs, including the Billings Urban Indian Health and Wellness Center (opened 2018). Billings Area (IHS)

  • California AreaSacramento, CA
    Works with 104 of the state’s 109 federally recognized tribes. California has the largest American Indian and Alaska Native population in the country.

    States: CA

    Diabetes deaths · 2005–200748.5 per 100,000 (age-adjusted), vs. 23.3 for the U.S. (2006). IHS Regional Differences in Indian Health, 2012 Edition

    What’s workingThe Area has two Youth Regional Treatment Centers, in Hemet and Davis. California Area (IHS)

  • Great Plains AreaAberdeen, SD
    About 130,000 people in North Dakota, South Dakota, Nebraska and Iowa.

    States: ND, SD, NE, IA

    Life expectancy · 2018–202067.1 years, vs. 78.8 for the U.S. (all races, 2019). IHS Life Expectancy report, 2018–2020

    What’s workingSeveral tribes have taken over management of their own health programs through contracts with IHS. Great Plains Area (IHS)

  • Nashville AreaNashville, TN
    36 tribes spread across the eastern and southeastern United States.

    States: Tribes in 15 eastern and southern states

    Diabetes deaths · 2005–200752.2 per 100,000 (age-adjusted), vs. 23.3 for the U.S. (2006). IHS Regional Differences in Indian Health, 2012 Edition

    What’s workingFourteen Title I and nine Title V programs are tribally administered, and Project TransAm has passed $33 million in equipment and supplies to Tribes over 10 years. Nashville Area: About Us (IHS)

  • Navajo AreaWindow Rock, AZ
    More than 244,000 people on and around the Navajo Nation, which covers more than 25,000 square miles of Arizona, New Mexico and Utah.

    States: AZ, NM, UT

    Life expectancy · 2018–202068.4 years, vs. 78.8 for the U.S. (all races, 2019). IHS Life Expectancy report, 2018–2020

    What’s workingAlongside IHS, the Navajo Department of Health and five Tribal health care corporations, including Tséhootsooí Medical Center, deliver care. Navajo Area (IHS)

  • Oklahoma City AreaOklahoma City, OK
    Oklahoma, Kansas and parts of Texas.

    States: OK, KS, part of TX

    Life expectancy · 2018–202067.8 years, vs. 78.8 for the U.S. (all races, 2019). IHS Life Expectancy report, 2018–2020

    What’s workingMany Tribes run their own health programs, from large hospitals to prevention and behavioral health programs. Oklahoma City Area (IHS)

  • Phoenix AreaPhoenix, AZ
    About 180,000 people from more than forty tribes in Arizona, Nevada and Utah.

    States: AZ, NV, UT

    Life expectancy · 2018–202075.1 years, vs. 78.8 for the U.S. (all races, 2019). IHS Life Expectancy report, 2018–2020

    What’s workingCare runs through both IHS- and tribally operated facilities, plus three Urban Indian health programs. Phoenix Area (IHS)

  • Portland AreaPortland, OR
    About 150,000 people in Oregon, Washington and Idaho.

    States: OR, WA, ID

    Life expectancy · 2018–202075.9 years, vs. 78.8 for the U.S. (all races, 2019). IHS Life Expectancy report, 2018–2020

    What’s workingTribes administer more than 74% of the Area’s budget through self-determination contracts and self-governance compacts. Portland Area (IHS)

  • Tucson AreaTucson, AZ
    Partners with the Tohono O’odham Nation and the Pascua Yaqui Tribe in southern Arizona.

    States: AZ

    Life expectancy · 2018–202074.0 years, vs. 78.8 for the U.S. (all races, 2019). IHS Life Expectancy report, 2018–2020

    What’s workingSelf-governance compacts with the Tohono O’odham Nation (2016) and Pascua Yaqui Tribe (2017) brought self-governance into all 12 IHS Areas. Tucson Area: About Us (IHS)

Photos courtesy of my mentor, Dr. Jeff Carter, who worked at Tséhootsooí.

Access is still an issue

Native communities need surgeons, physicians, nurses and more. Bring your skills.

In fiscal year 2024, 30% of IHS health care provider jobs were vacant, and 38% of physician jobs. GAO, February 2025

Recruiting and keeping clinicians

04Chapter 4 of 6

Funding and disparities

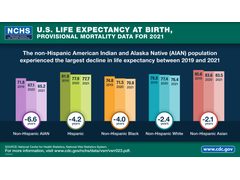
Life expectancy for American Indian and Alaska Native people fell to 65.2 years in 2021, the same as the whole U.S. population in 1944, and dropped 6.6 years from 2019 to 2021. CDC National Center for Health Statistics, 2022

Native health care is vastly underfunded

Policy to support

As of October 2026
The west front of the U.S. Capitol under a blue sky, with a green lawn in front
Photo: Architect of the Capitol (public domain)
Call your senators

Special Diabetes Program for Indians (S. 2211)

The program’s funding runs out December 31, 2026, unless Congress acts. S. 2211 would extend it through 2027. It has sat in the Senate HELP Committee since July 2025. IHS NCUIH

The ask Ask your senators to cosponsor S. 2211 and to press the Senate HELP Committee to act on it before December 31.

What the program built: share of SDPI programs reporting each service, 1997 to 2013

  • 30% to 96%diabetes clinical teams
  • 34% to 98%diabetes patient registries
  • 36% to 97%culturally tailored diabetes education

Bullock et al., Vital Signs: Decrease in Incidence of Diabetes-Related End-Stage Renal Disease among American Indians/Alaska Natives, MMWR, 2017, Table 2

On the Senate calendar

IHS Workforce Parity Act (S. 632)

Would let IHS scholarship and loan-repayment clinicians serve their commitment part-time. The Senate Committee on Indian Affairs approved it in May 2025.

The ask Ask your senators to support bringing S. 632 to a vote on the Senate floor.

In Senate Finance

Tax-free IHS loan repayment (S. 2022)

Would make IHS loan repayment and scholarship awards tax-free, as National Health Service Corps awards already are. Part of the Tribal Tax and Investment Reform Act.

The ask Ask your senators to cosponsor S. 2022 and urge the Senate Finance Committee to take it up.

05Chapter 5 of 6

Research

Research that shaped my thinkingStudies on disparities and on what’s working, grouped by topic.What’s working · Life expectancy and mortality · Surgical care and outcomes · Cancer · Maternal health · Workforce · Funding and policyShow researchHide research
What’s working: Native-led care and solutionsDecrease in Diabetes-Related Kidney Failure among American Indians/Alaska Natives, 1996–2013The Nuka System of Care: improving health through ownership and relationshipsProcess and Outcomes of Patient-Centered Medical Care With Alaska Native People at Southcentral FoundationDental therapists linked to improved dental outcomes for Alaska Native communitiesA Collaborative Case Study: The Office of Native MedicineIndians Into Medicine (INMED)
Evidence

Vital Signs: Decrease in Incidence of Diabetes-Related End-Stage Renal Disease among American Indians/Alaska Natives — United States, 1996–2013.

Bullock et al., MMWR (CDC), 2017.

After IHS built team-based, population-focused diabetes care, later strengthened by the Special Diabetes Program for Indians (created by Congress in 1997), diabetes-related kidney failure among AI/AN adults fell 54% from 1996 to 2013, the steepest drop of any group. By 2013 the rate among AI/AN adults with diabetes matched the rate among white adults with diabetes.

Evidence

The Nuka System of Care: improving health through ownership and relationships.

Gottlieb, International Journal of Circumpolar Health, 2013.

Southcentral Foundation, an Alaska Native–owned health system in Anchorage, rebuilt care around relationships. The Alaska Native people it serves are “customer-owners” who help shape their own services, and it serves more than 60,000 people.

  • 35% to 95%+on a primary care team, 1996 to now
  • −42%ER and urgent care use
  • 94%satisfied with respect for culture
“A 36% reduction in hospital days, 42% reduction in ER and urgent care usage, and 58% reduction in specialty clinic visits have been sustained for 10 and above years.”

Gottlieb, The Nuka System of Care: improving health through ownership and relationships, 2013, Results

Evidence

A Collaborative Case Study: The Office of Native Medicine.

Joe et al., American Indian and Alaska Native Mental Health Research, 2016.

At the Chinle Comprehensive Health Care Facility on the Navajo Nation, traditional Navajo practitioners are on staff and work with physicians every day in the hospital and clinics, offering cultural diagnostic services, joining rounds and training staff. Patients, families and many providers valued having them there.

Indians Into Medicine (INMED).

University of North Dakota School of Medicine & Health Sciences.

In 1972 there were only 26 American Indian physicians in the country. Since its founding in 1973, INMED has supported the graduation of more than 280 American Indian physicians, with programs from seventh grade through graduate school.

See all in the Evidence Library →

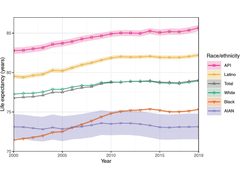
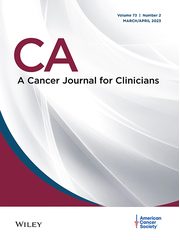
Life expectancy and mortalityIHS Life Expectancy report, 2018–2020Provisional Life Expectancy Estimates for 2021Life expectancy by county, race, and ethnicity in the USA, 2000–19Leading Causes of Death and All-Cause Mortality in American Indians and Alaska NativesDisparities Fact Sheet
Evidence NCHS visual abstract with a bar chart of U.S. life expectancy declines by race and Hispanic origin, 2019 to 2021

Provisional Life Expectancy Estimates for 2021.

CDC National Center for Health Statistics, 2022.

Life expectancy for American Indian and Alaska Native people fell to 65.2 years in 2021, the same as the whole U.S. population in 1944, and dropped 6.6 years from 2019 to 2021.

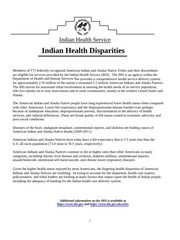
Evidence First page of the Indian Health Service Disparities fact sheet

Disparities Fact Sheet.

Indian Health Service, October 2019.

AI/AN people living in IHS service areas have a life expectancy 5.5 years shorter than the U.S. all-races population. Compared with all Americans, their death rates are 3.2 times higher from diabetes, 4.6 times higher from chronic liver disease, and 2.5 times higher from unintentional injuries.

See all in the Evidence Library →

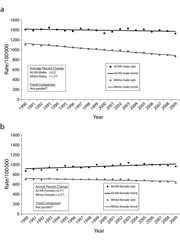
Surgical care and outcomesDisparities and Risk Factors for Surgical Complication in American Indians and Native HawaiiansPost-operative outcomes in Indigenous patients in North America and Oceania: A systematic review and meta-analysisOvercoming Disparities in Surgical Care among Native AmericansAccess to Cancer Care in Native American Reservations in the US
Evidence Bulletin article illustration with a terracotta and cream pattern

Overcoming Disparities in Surgical Care among Native Americans.

Sutton, Kills-First, and Sheppard, Bulletin of the American College of Surgeons, 2022.

Native American patients are less likely to get curative cancer operations and follow-up treatment. The authors argue that bringing more Native people into medicine is key to rebuilding trust.

See all in the Evidence Library →

CancerCancer statistics for American Indian and Alaska Native individuals, 2022

See all in the Evidence Library →

Maternal healthPregnancy-Related Deaths Among American Indian or Alaska Native Women: Data From Maternal Mortality Review Committees in 36 U.S. States, 2017–2019

See all in the Evidence Library →

WorkforceRepresentation of American Indian and Alaska Native Individuals in Academic Medical TrainingIndian Health Service: Agency Faces Ongoing Challenges Filling Provider Vacancies (GAO-18-580)

See all in the Evidence Library →

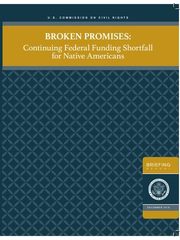
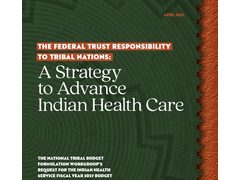
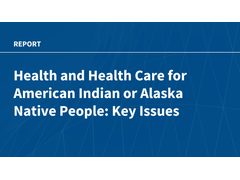
Funding and policyIndian Health Service: Spending Levels and Characteristics of IHS and Three Other Federal Health Care Programs (GAO-19-74R)Broken Promises: Continuing Federal Funding Shortfall for Native AmericansFY 2027 National Tribal Budget Formulation Workgroup Budget BookHealth and Health Care for American Indian or Alaska Native People: Key Issues

See all in the Evidence Library →

Red sandstone cliffs above the green canyon floor at Canyon de Chelly, Arizona
Community research

Research led by communities

Canyon de Chelly, Navajo Nation · Photo: NPS, public domain
A traditional log hogan with an earthen roof beside a crosswalk, with the hospital building behind it under a blue sky
Organizations & resources

Organizations doing the work

Tséhootsooí Medical Center, Fort Defiance

Indian Health Service and Native physicians

Tribal health policy and public health

Surgical workforce and service pathways

06Chapter 6 of 6

Voices

A decorated metal arch on a gravel island at the end of a concrete walkway, with red sandstone formations and a clear blue sky beyond
Voices from the community

Voices from the community

Native patients, healers, clinicians and elders, speaking for themselves. These are some of the voices I’ve learned from.Fort Defiance, Arizona

Books by Native physicians

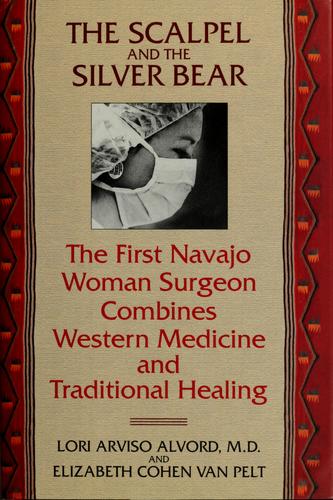
Cover of The Scalpel and the Silver Bear with a photo of a surgeon in a surgical cap and mask, framed by a red Navajo pattern border

The Scalpel and the Silver Bear

Dr. Lori Arviso Alvord (Diné), with Elizabeth Cohen Van Pelt.

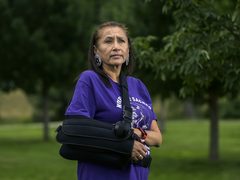
By the first member of the Navajo tribe to be board-certified in surgery.

Navajo traditional medicine

Memoirs, films, podcasts and stories

Medicine Woman

Dir. Christine Lesiak and Princella P. RedCorn; narrated by Joy Harjo. PBS, 2016.

Today’s Native women healers, alongside the story of Dr. Susan La Flesche Picotte.

The Native Elder Storytelling Project

National Indian Council on Aging with nDigiDreams (ongoing).

Short digital stories made and narrated by elders, about health, caregiving and community.

Native America Calling

A daily national call-in radio program (ongoing).

Native hosts and listeners talk about health, policy and community life every weekday.